With more than 20 different email campaign reports nuevoMailer will help you analyze and understand better your email campaigns performance and improve your email marketing strategy.
All key reporting metrics included
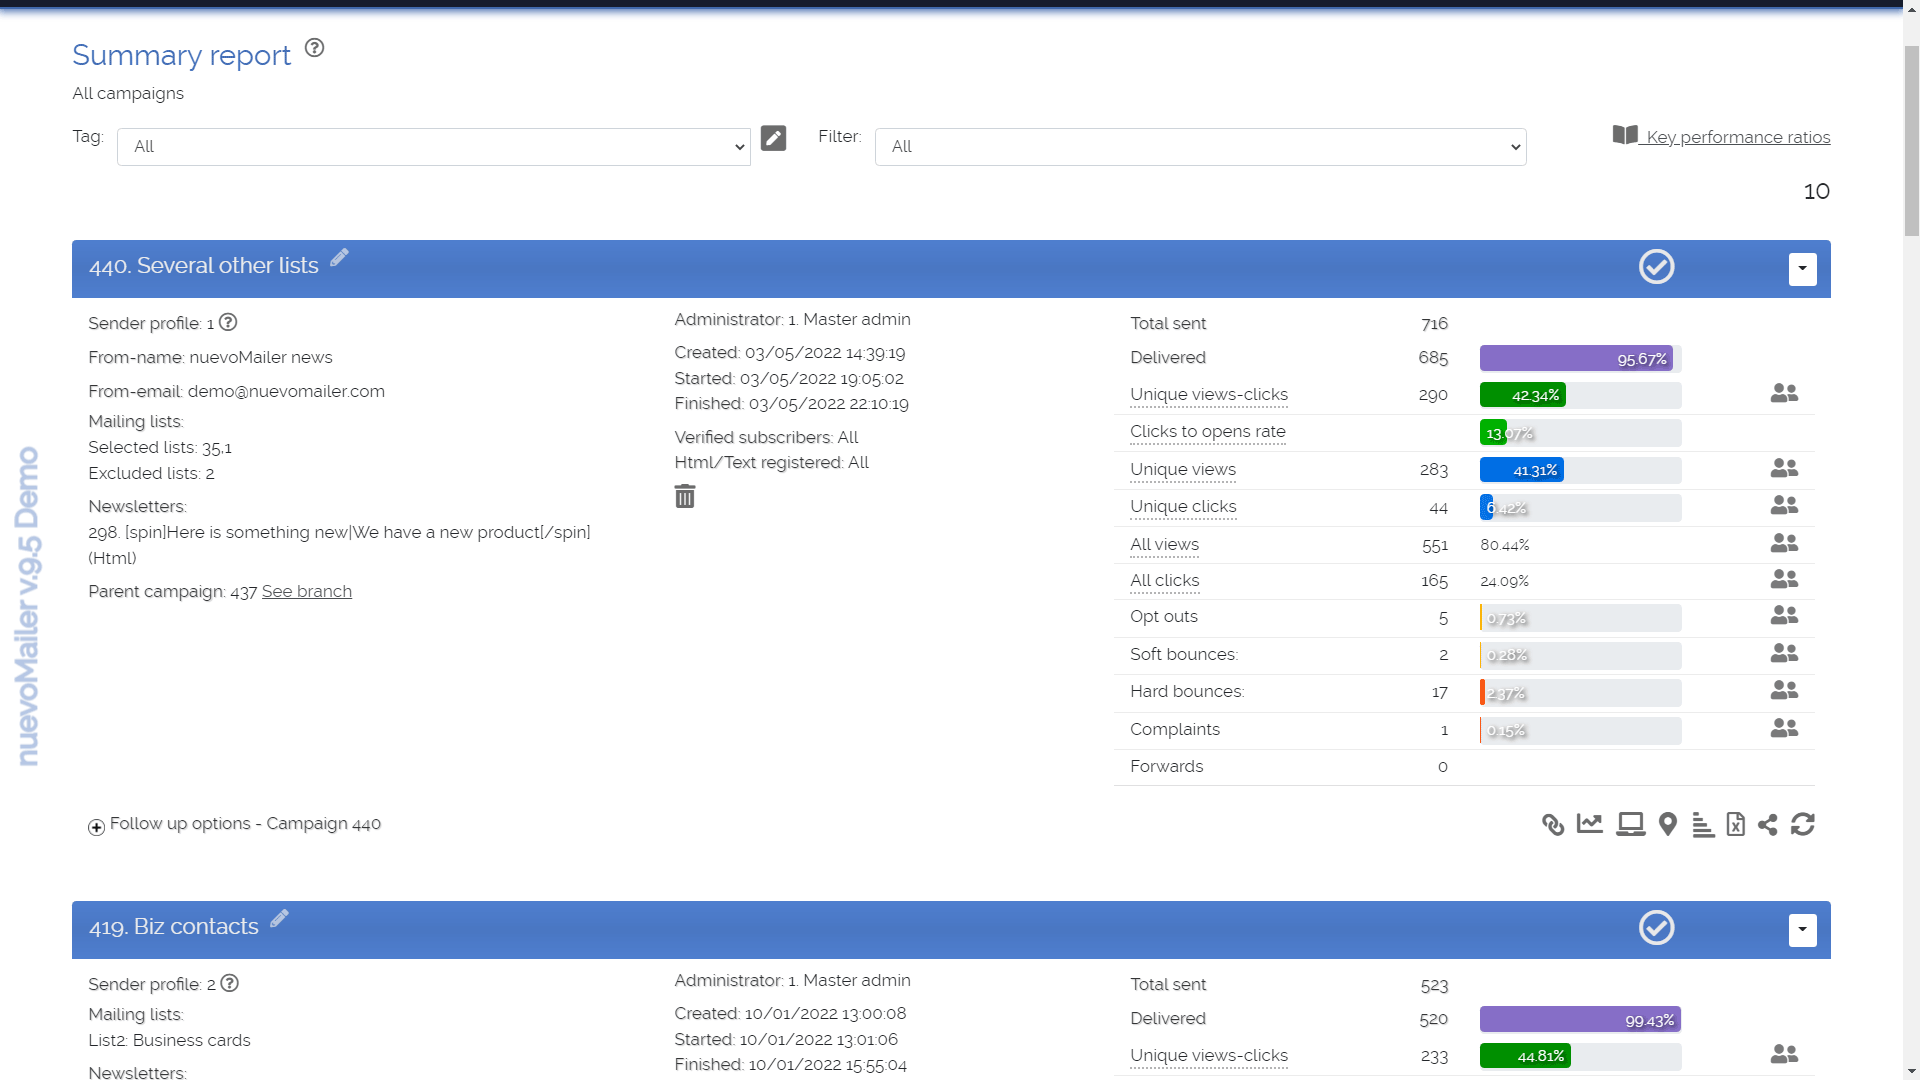
At the top level you have the summary report where you can see:
Unique views-clicks: the total number of subscribers who took some sort of action; either clicked or opened the newsletter.
Clicks to views ratio: measures engagement. What percentage of the subscribers who opened the newsletter clicked at least once.
Unique views (open-rate): the total number of subscribers who opened the newsletter at least once.
All views: the total number of opens including multiple opens from the same subscriber.
Unique clicks (click-through rate): the total number of subscribers who clicked at least once.
All clicks: the total number of clicks this newsletter received.
Opt outs (opt-out rate): how many subscriber opted-out.
Bounces (bounce rate): soft and hard bounces resulted from this campaign.
Complaints (complaints rate): how many subscriber complained (for spamming or other reason).
Forwards: to how many email accounts this newsletter was forwarded.
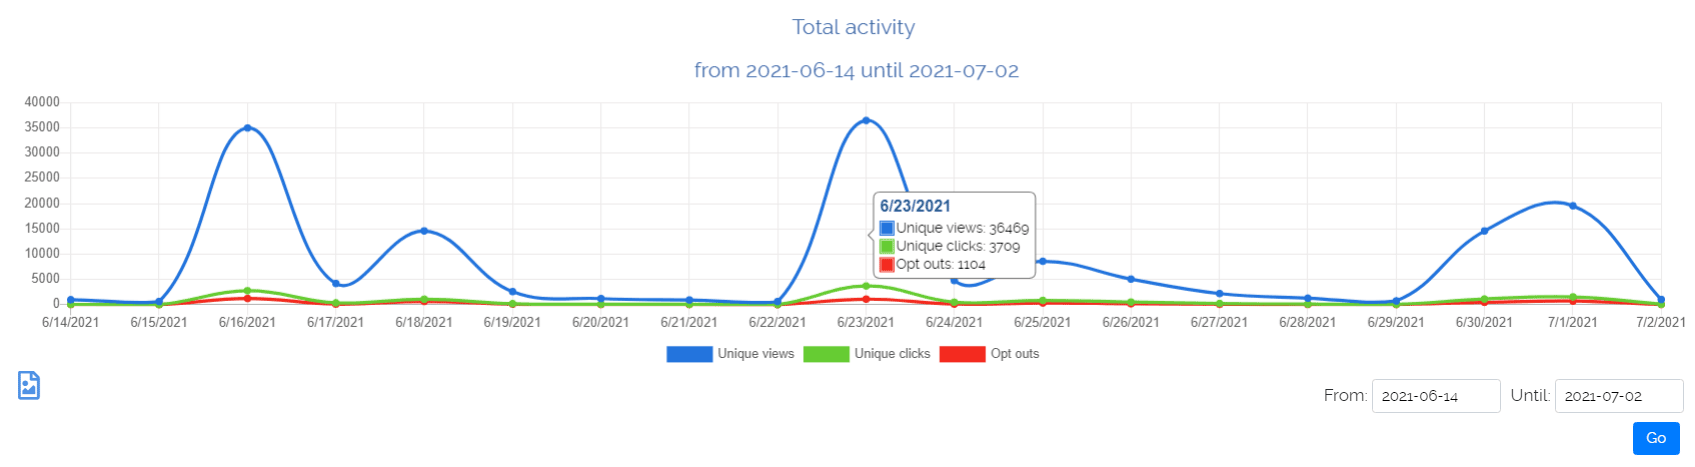
The total activity chart that you find at your welcome page.
Campaign summary report.
Complete email tracking and reporting
Every outgoing email and page visit is tracked. Not only the newsletters you use in your campaigns but single ones like welcome, goodbye, trigger, transactional as well as visits to landing pages.
Subscriber details
At the next level you can see the subscribers for the above metrics.
And then for each subscriber you have a report with all his clicks & opens across all emails he received and landing pages he visited along with a time-line chart. A detailed clicks/views history for every subscriber.
Subscriber clicks for campaign: who, when, where.
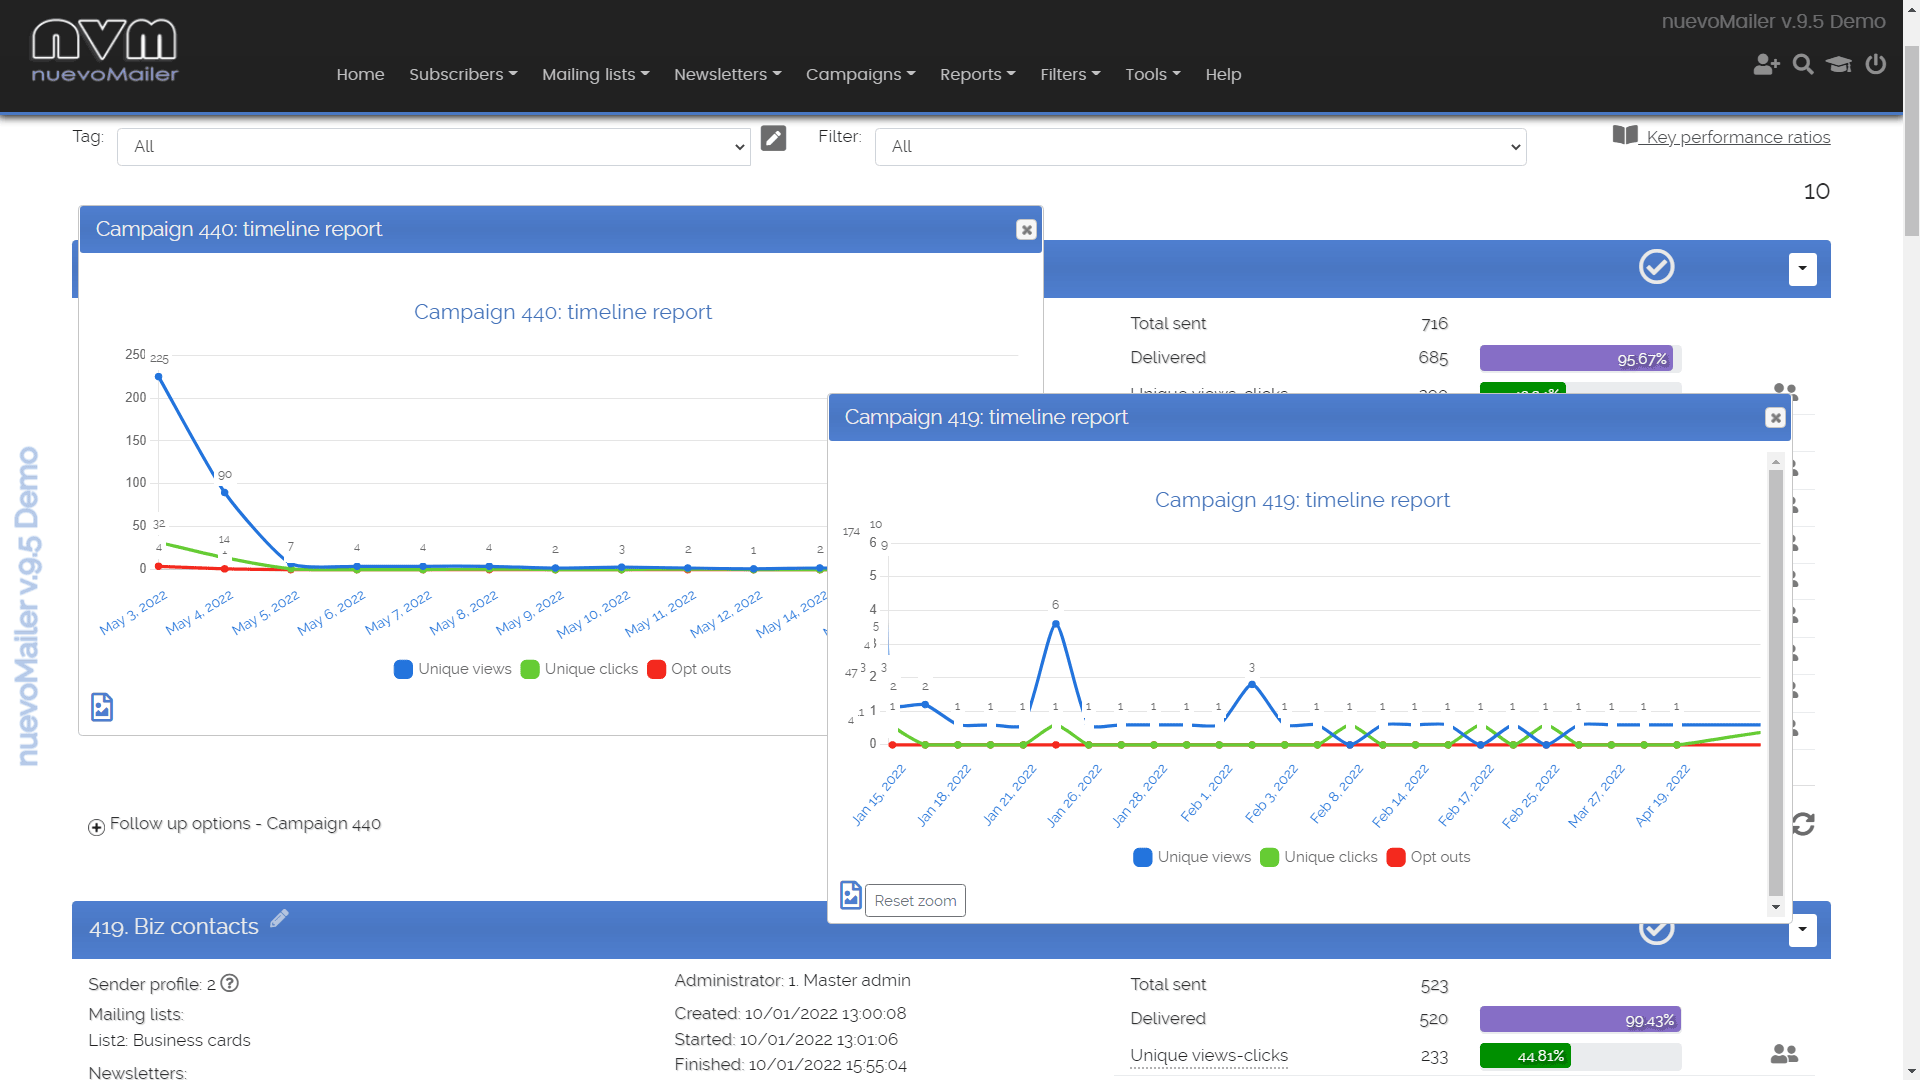
Time-line report (trend report)
This report shows daily unique views, clicks and opt-outs and how they evolved over time. By examining this report you get a lot of insight about the impact of your email campaign over time: how many and when subscribers read your newsletter.
You can have this report for each campaign, selected campaigns and all campaigns (in your welcome page with selectable time period).
The Campaign time-line or trend report gives you amazing insights as to how your subscribers interact with your newsletters over time.
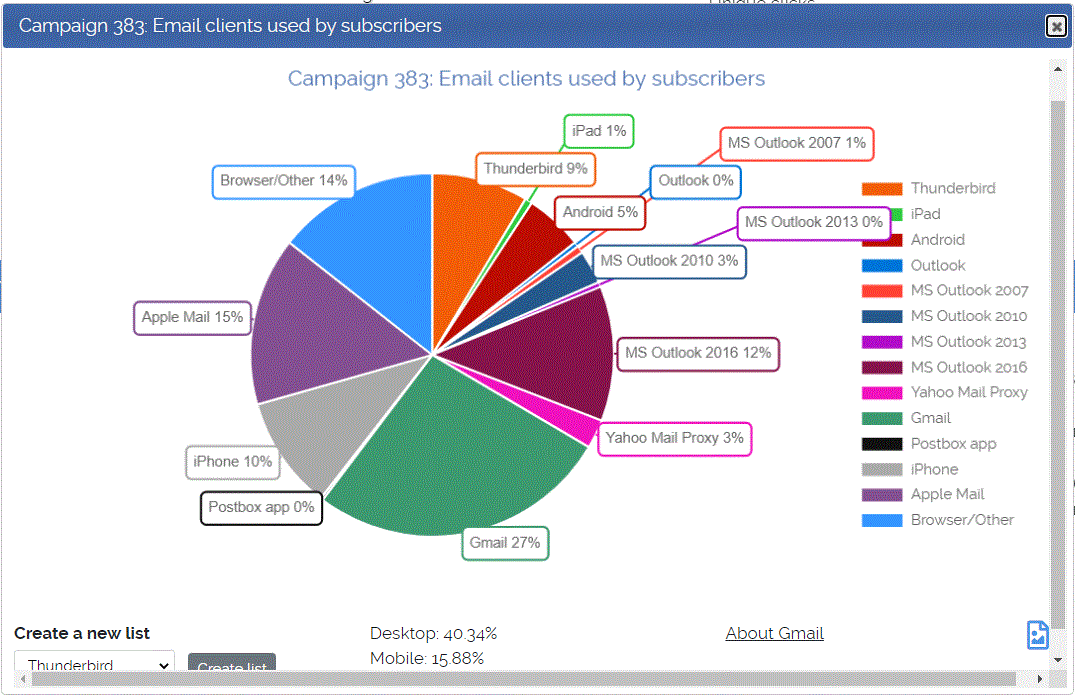
Email clients report
With this chart you can see which email programs your subscribers use to read your newsletters.
Also considered as one of the most insightful email campaign reports. Depending on your audience it provides useful insights on how to optimize your newsletter for mobile vs desktop email clients.
Email clients chart.
Links clicked by campaign
This is another top level report that shows the hyperlinks and the number of clicks they received. You can also see the subscribers.
Similarly, for every hyperlink you can see the total clicks across all campaigns and a more detailed report by campaign.
Link tracking statistics for all campaigns.
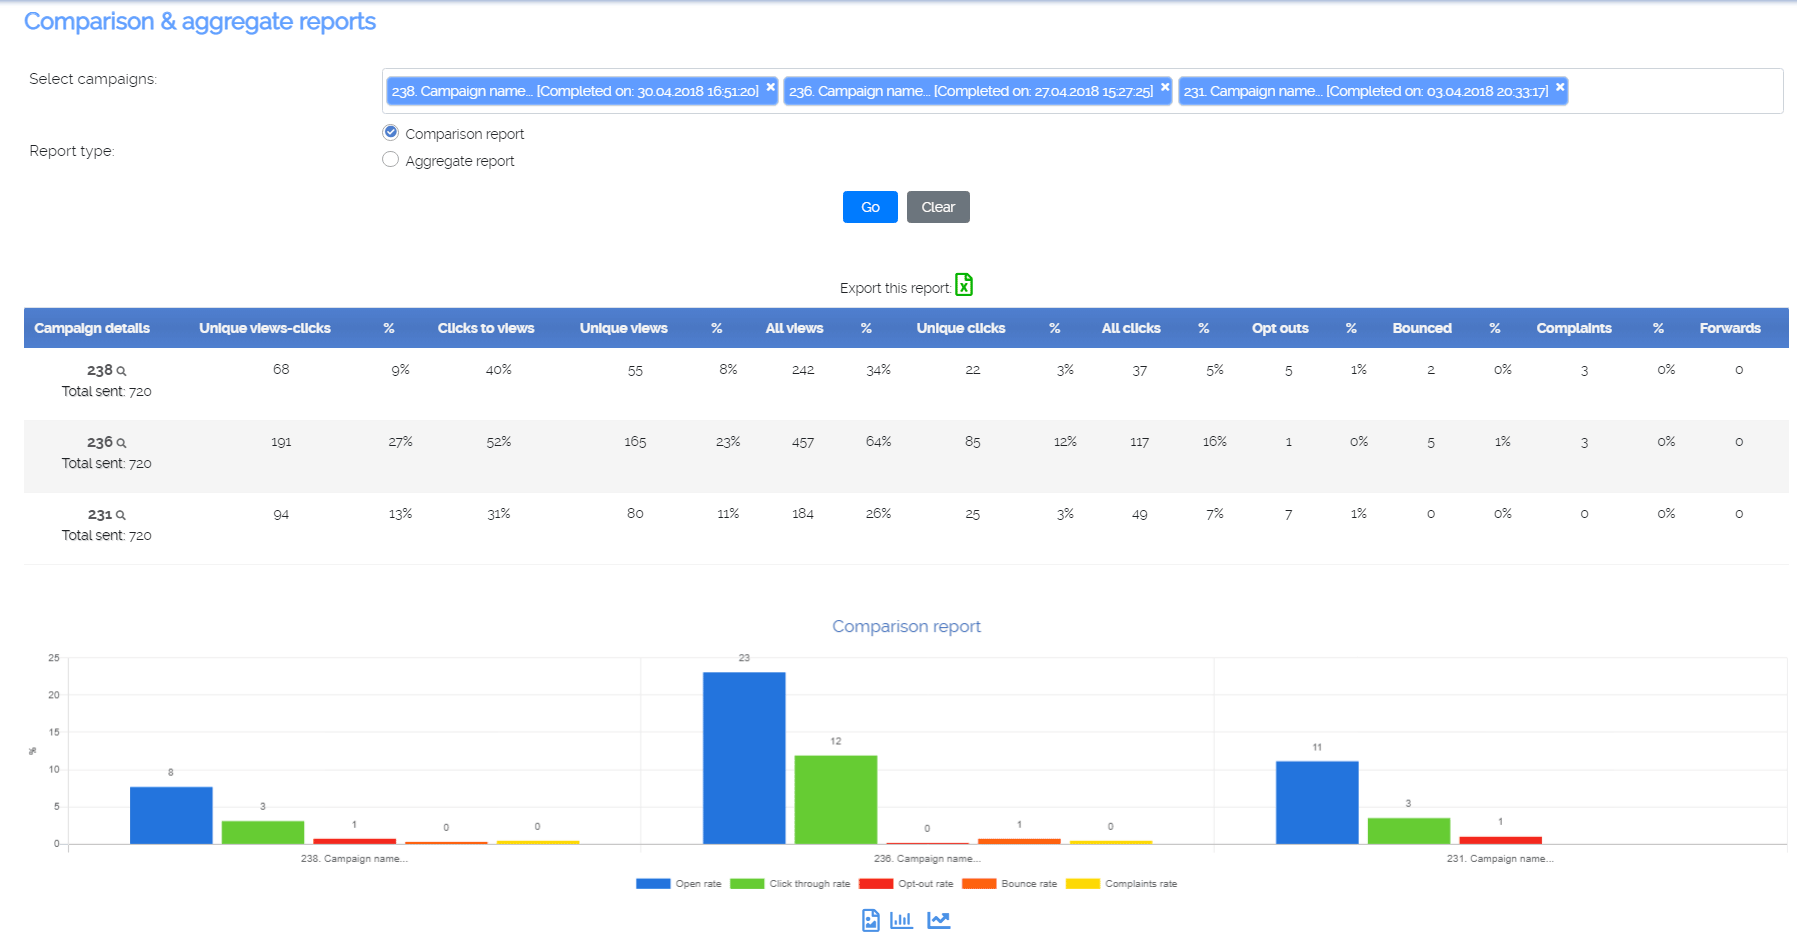
Custom reports and charts
A strong reporting feature of our email marketing software is that enables you to compare selected campaigns (table and chart report).
In addition you can see an aggregate statistics report from selected campaigns.
Custom reports: campaign comparison and aggregate reports.
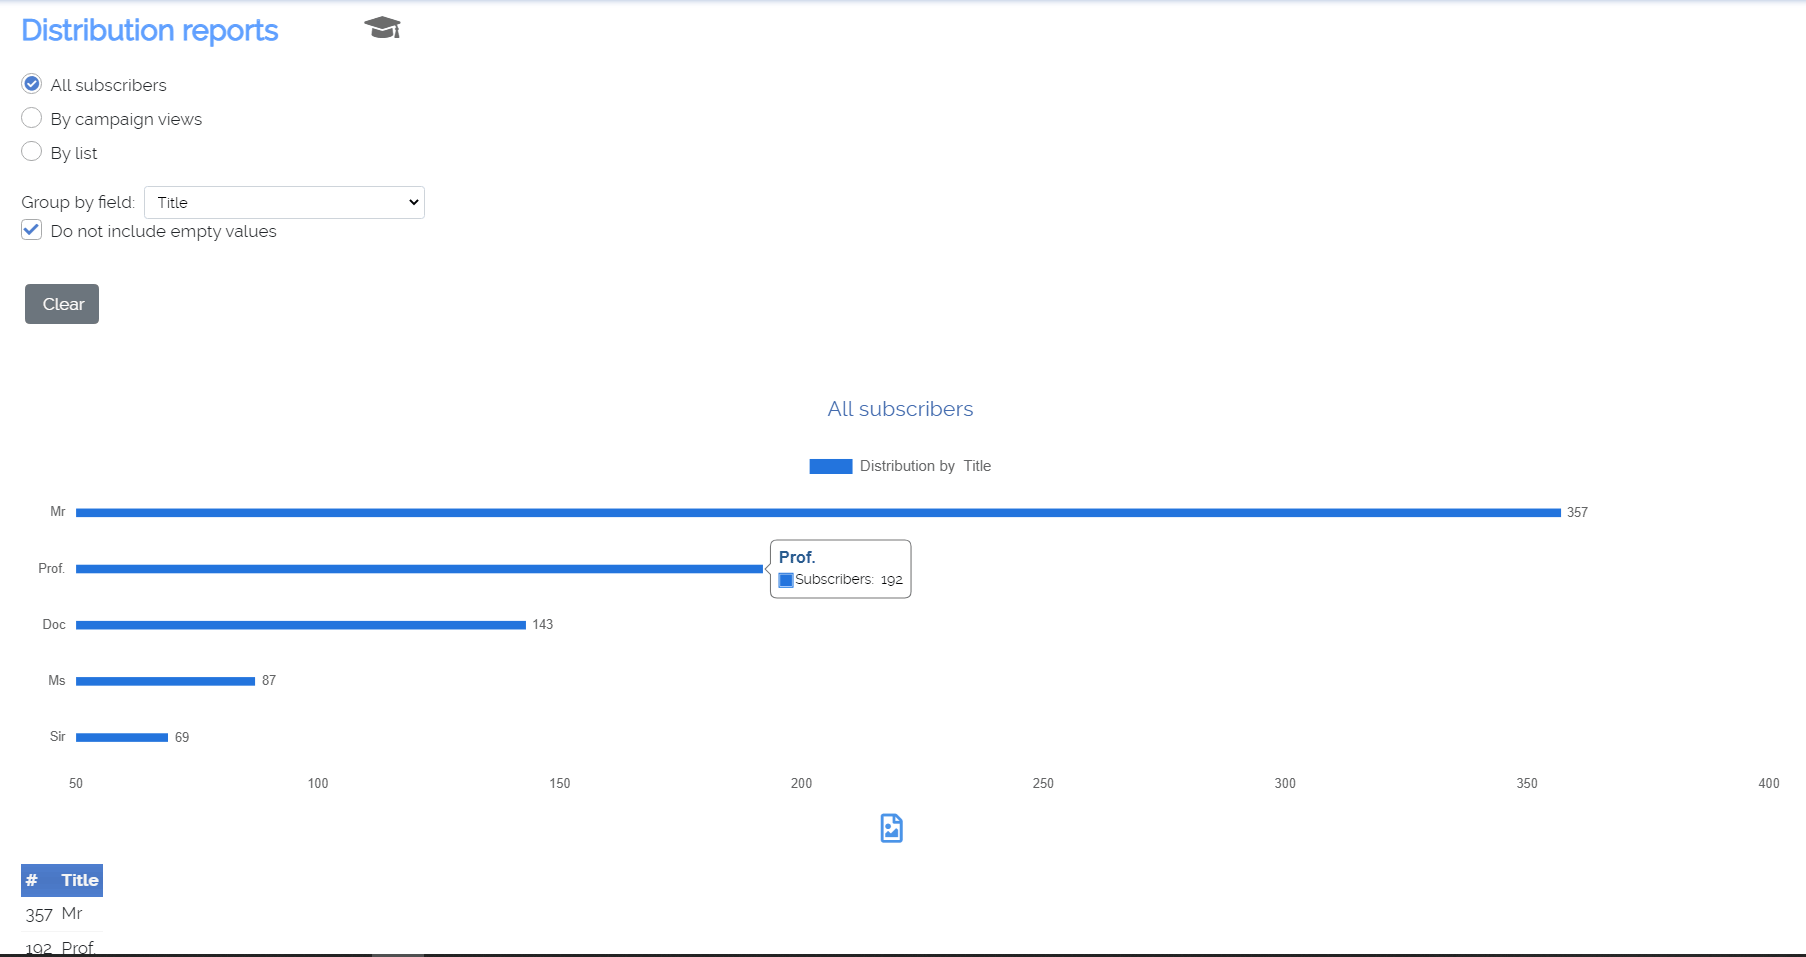
Distribution reports
Distribution charts & reports are closely related to the setup of your custom subscriber fields.
Distribution reports are available for fields for which you define options (radio buttons, drop-down menus). Examples: distribution by gender, region, country etc. Learn more.
An example of a distribution by subscriber Title.
Other reports
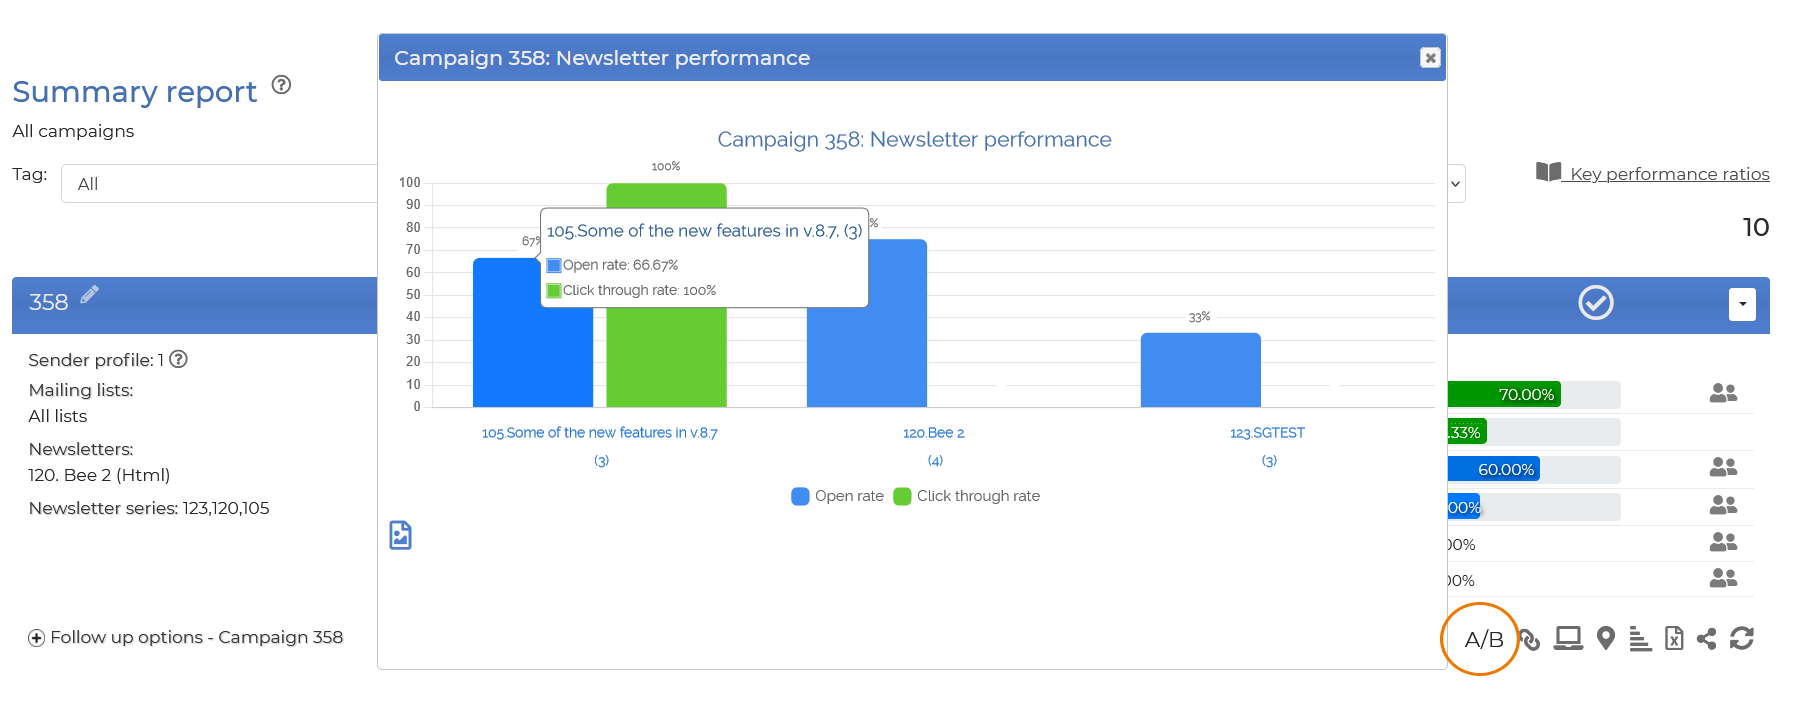
A/B split test report: if you choose to rotate newsletters within the same campaign you can see graphically which newsletter received most opens and clicks.
Top 10 email campaigns ever.
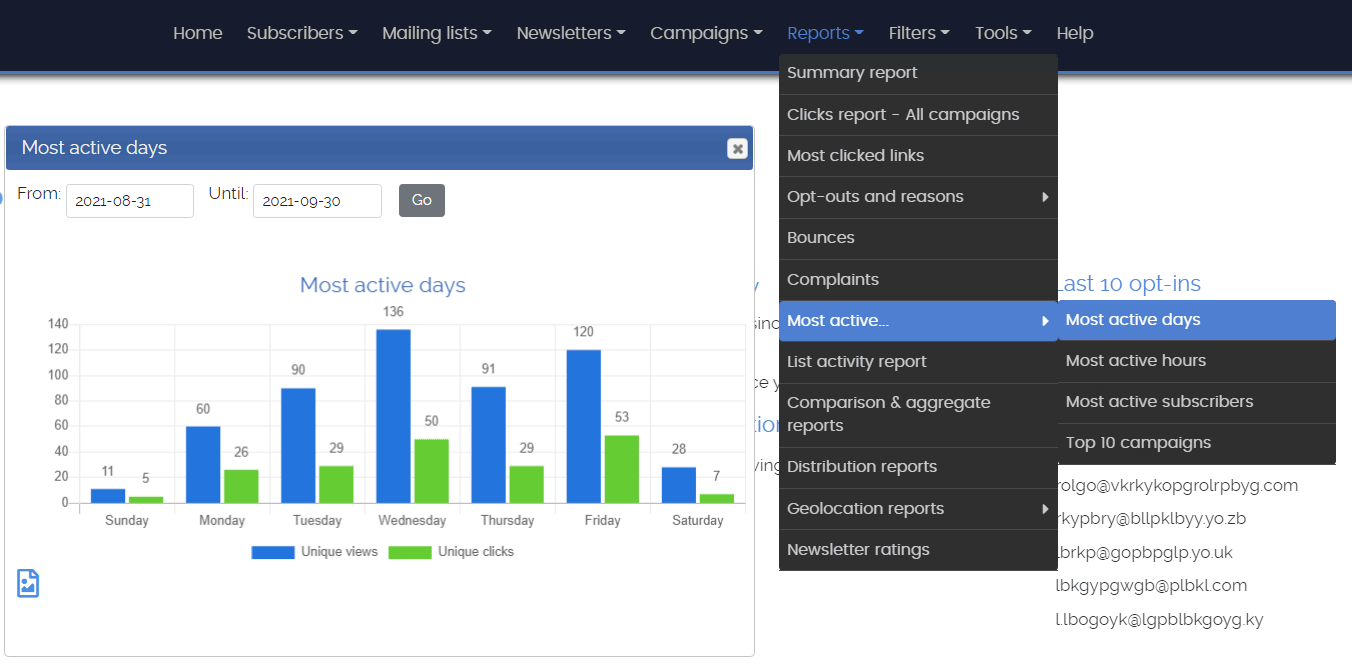
Most active days.
Activity by hour of day. So you know when is best to send your campaigns.
Multiple views analysis. This shows for example that 20% of subscribers opened once, 15% opened twice etc.
A/B/C split test report. One campaign, 3 different newsletters. In parenthesis it shows how many times it was sent.
Most active hours and days charts.
List traffic & growth reports
Shows how many subscribers opted-in/-out since the list was created.
The list activity report will show monthly opt-ins (from a form), imports (from the administrator) and opt-outs. It can reveal how a sign-up form (and a list) is performing over time.
With this feature you can also get an indication regarding deliverability by major domains (like Hotmail, Gmail). Here is how: do an advanced search for emails that contain 'gmail'. With the result create a new list. Then check the list activity report.
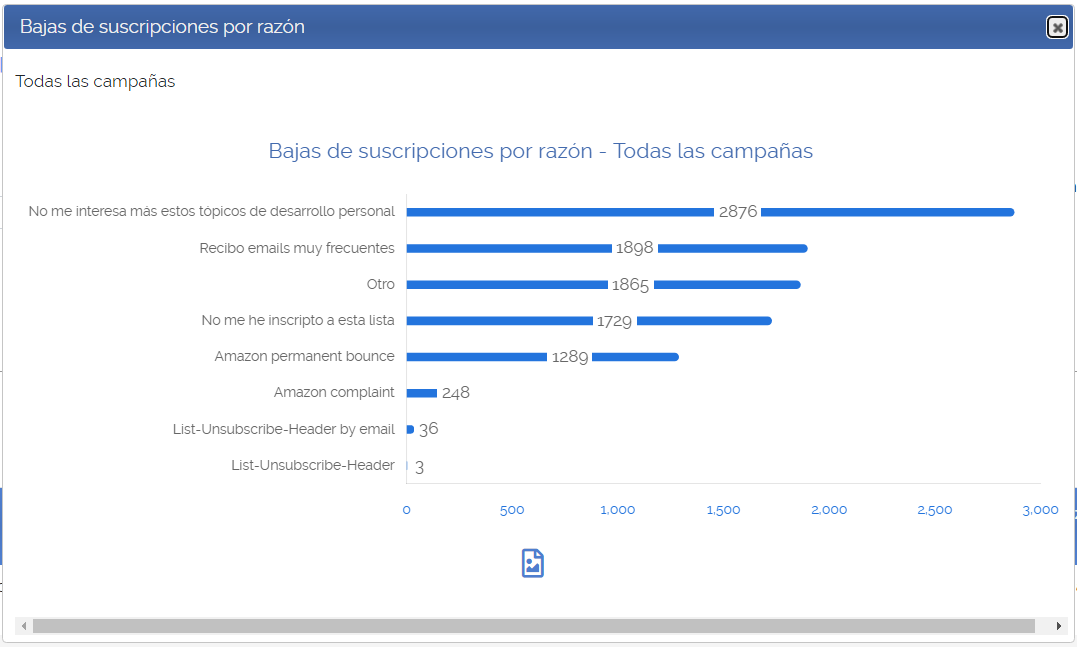
Opt-outs report
Shows who and when a subscriber opted-out and what type of opt-out it was. When the "Provide an opt-out reason" feature is enabled you can see the reasons in this report.
Email campaign reports enable you to take further action
You can create follow-up email campaigns, lists and mailing filters.
Opt-outs report & Opt-out reasons chart (En español).
Newsletter ratings report
Since you can ask subscribers to rate (or vote) a newsletter using the "smart links" feature, in this report you will see the results (hits and ratios).
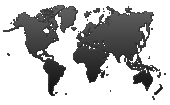
Geolocation and Geo-mapping
These reports can be generated for all subscribers, a specific list or a specific campaign. You can create reports for specific regions/countries or worldwide.
They work either with IP geolocation or also if you are collecting valid values for subscribers countries. Learn more.
Your email campaign reports are:
Exportable to spreadsheets.
Charts are exported as images.
Displayed in your local time with a configurable format.


 Products
 .com
.com